As far as (at least) svn trunk revision 2337 of GrandOrgue the only available swellbox model has been an amplitude reduction version only. Limited by the AmpMinLevel of the ODF the swell pedal has reduced the amplitude in scale accordingly (from AmpMinLevel/100 to 1.0 = fully open).
Real pipe organ enclosures do not (usually) scale the amplitude evenly across all the frequencies when the swell box shutters are closed. Thus has a quest begun to implement a better swell box model for GO. There are test patches available at https://sourceforge.net/p/ourorgan/mailman/ourorgan-developers/ for those who build GO themselves. The patches use different types of filters to alter the amount of dB reduction differently for the frequencies – mainly a shelf filter and a low pass filter challenges the current GO swell box model.
During my work on the alternative swell box models I’ve done a few test recordings of real pipe organs to compare what happens when the swell box is closed. The immediate result is a bit daunting as all the three recorded organs behave differently and not at all in direct line with some research done on this subject.
In all three tests I’ve played a (more or less) full swell with the shutters open for a few seconds then closed them until fully closed and held that for a few seconds. I played clusters both high and low to cover most of the frequencies available in that division.
The recordings were cut in Audacity and i used the spectrum feature with different selections for open and closed swell to get an image and export of actual dB for the different frequencies. I then put the exported frequencies into a libreoffice calc sheet and made a simple subtraction of the closed measurements from the open to get actual differences.
My home pipe organ
Recorded file available here.
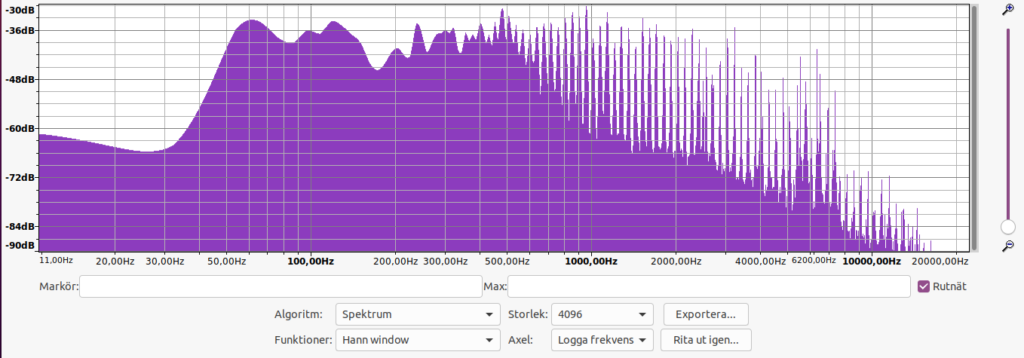
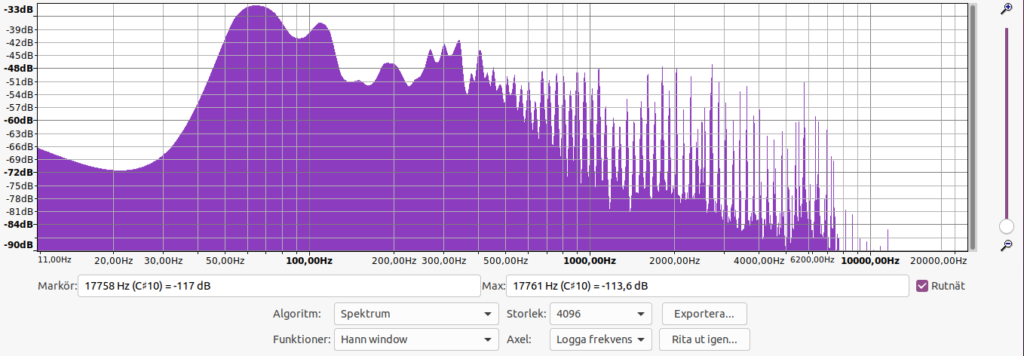

At around 400-500 Hz there is a reduction about 15 dB which varies slightly in average to about 10 dB from around 2 kHz to 7,5 kHz from where it climbs towards 15 dB between about 11 kHz and 17 kHz then it slightly drops again towards 10 dB reduction. All the time there are spikes in both directions where some frequencies are reduced more and some actually less. Also note that below 400 Hz there is clearly less reduction going on.
Bureå church main organ
Recorded file available here.
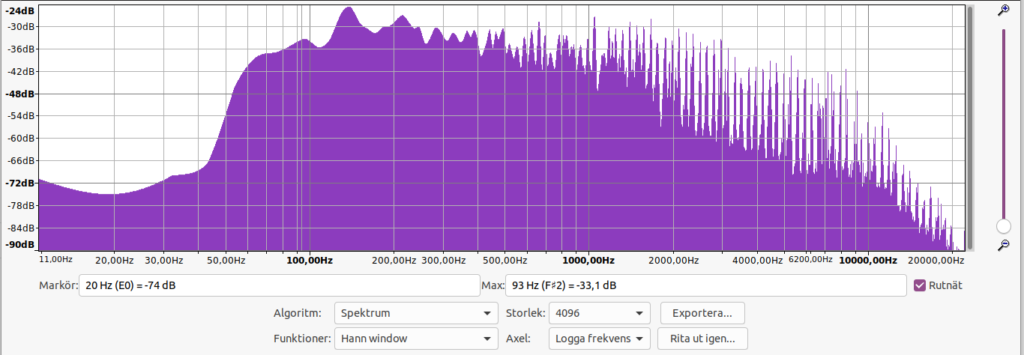
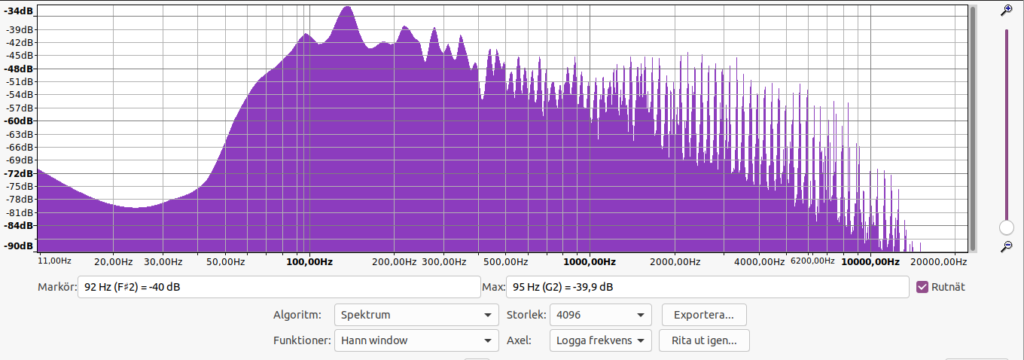
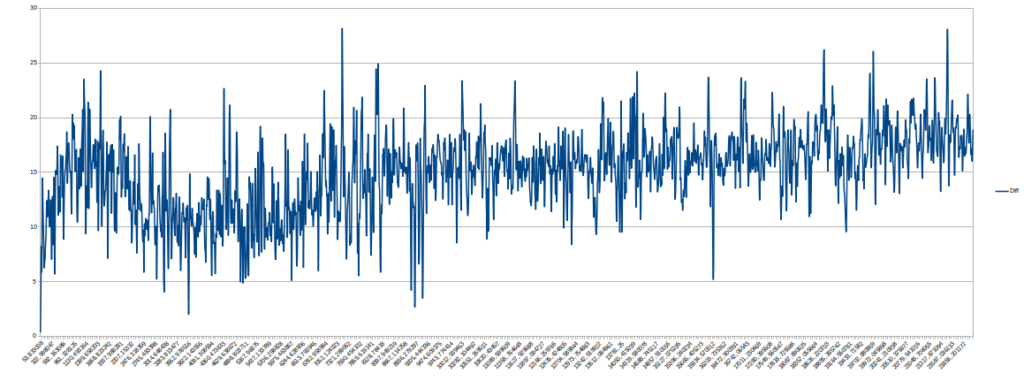
Here we reach an average dB reduction of 15 at around 400 Hz with a quicker reduction of the bass frequencies compared to my home organ. It falls down to about 10 dB reduction between 2,5 and 6 kHz from where it rises to 15 dB reduction at 8 kHz and then continously, albeit slowly, keep going up towards 20 dB reduction. Again there are spikes of greater and lesser reduction for certain frequencies but as a whole it feels more predictable compared to how my home organ behaves.
Bureå funeral chapel
Recorded file available here.
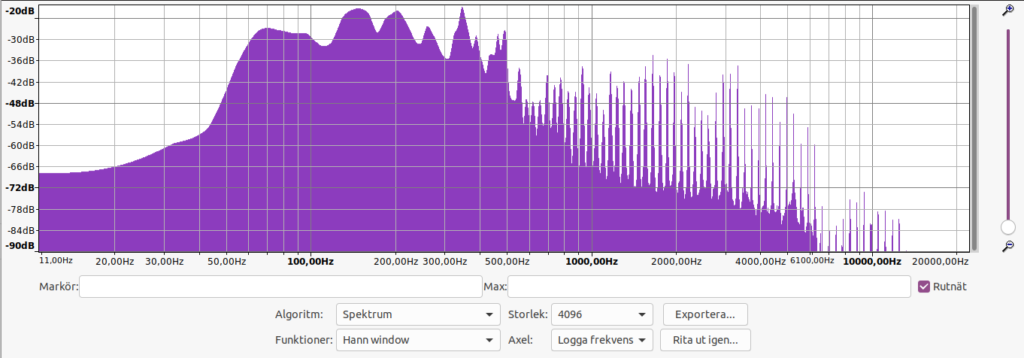
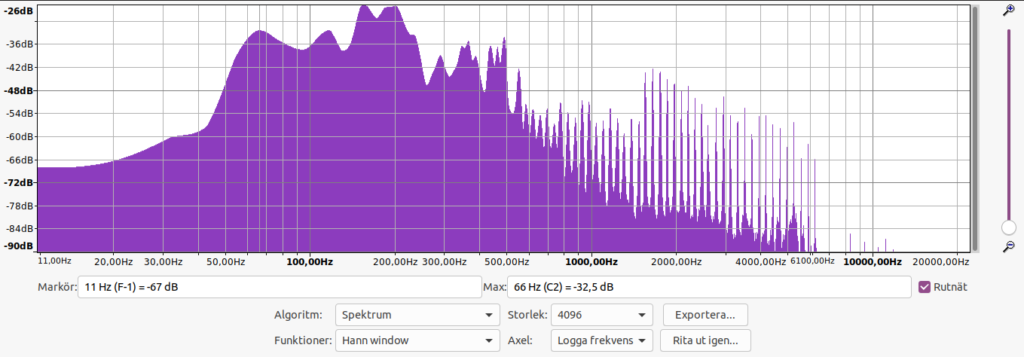
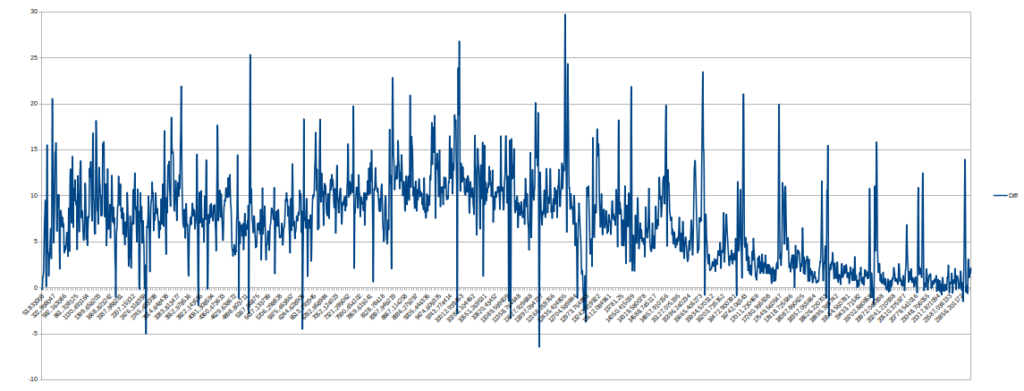
The enclosure of Bureå funeral chapel clearly behaves very differently from both my home organ and the Bureå church organ. Overall there’s much less reduction going on. We hit a first peak of 10 dB reduction already before 400 Hz but it quickly falls down a little and again reaches 10 dB reduction around 800 Hz where it stays until 1,6 kHz when it again falls down a little with a few up and downs until it stabilizes around 10 dB reduction at 7 kHz where it basicly stays until about 12,5 kHz where it begins falling down in reduction until it’s basically not reducing very much at all from 17 kHz and upwards.
Conclusion so far?
There’s obviously more than only an even amplitude reduction going on in the recorded swell boxes. Also it’s obvious that no of the recorded versions exactly behaves in the same way. No simple filter will be able to exactly reproduce the diversity that can be found in the real life swell boxes of pipe organs.
There are certain common factors – for instance that the peak reduction is basically reached somewhere around 400 Hz after which different scenarios take place. Thus any kind of filter that allows the bass frequencies to be less reduced than the middle/high will be a better model than pure amplitude reduction.
Maybe it’s true like Nick Appleton suggested that the filtering should be diversified down to per pipe level to better be able to simulate the swell box behaviours while still using a simple first order filter. Currently the question is: should we use the shelf filter or low pass filter patches as basis?
